Module 10: ASEAN Finance and Accounting
ชุดวิชาภาษาอังกฤษสำหรับงานอาชีพในประชาคมอาเซียน ให้บริการเปิดสอนในภาคการศึกษาที่ 2/2557 จำนวน 15 โมดูลการเรียน
Table of Contents
Reading Text & Presentaion
SECTION 10.2
10.2 Balance sheets and income statements
PRESENTATION
10.2.1 The balance sheet
A balance sheet, also known as a "statement of financial position," reveals a company's assets, liabilities and owners' equity (net worth). The balance sheet, together with the income statement and cash flow statement, make up the cornerstone of any company's financial statements. If you are a shareholder of a company, you need to understand how to read the balance sheet and how to analyze it.
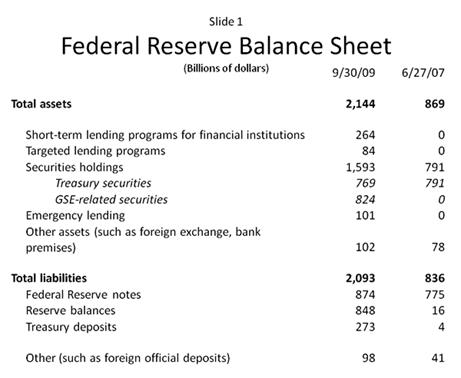
(Source: http://www.federalreserve.gov/newsevents/speech/bernanke20091008a.htm retrieved 4/7/2014)
How the balance sheet works
The balance sheet is divided into two parts that, based on the following equation, must equal each other, i.e., “balance”. The formula behind the balance sheets is
Assets = Liabilities + Shareholders' Equity
This means that assets, or the means used to operate the company, are balanced by a company's financial obligations, along with the equity investment brought into the company and its retained earnings.
Assets are what a company uses to operate its business, while its liabilities and equity are two sources that support these assets. Owners' equity (referred to as shareholders' equity in a publicly traded company) is the net worth of the company (Assets minus Liabilities): it is the amount of money invested initially into the company plus any retained earnings minus any losses; it represents a source of funding for the company.
It is important to note that a balance sheet is a snapshot of the company's financial position at a single point in the past, the end of the company’s fiscal year. It is always an indication of what the company’s position was, not what it is at the present moment.
· Types of assets
a. Current assets
Current assets have a lifespan of no more than one year, meaning they can be converted easily into cash. Assets in this category include (1) cash, (2) cash equivalents, (3) accounts receivable, (4) inventory, and (5) prepaid expenses. Cash also includes bank demand accounts (accounts from which the business can withdraw its money at any time without restriction) and checks, as well as just currency in hand. Cash equivalents are very safe investments that can be quickly converted into cash; government treasury bonds are one such example. Accounts receivable are the short-term obligations (debts) owed to the company by its customers. When a business sells a product or service to a customer on credit, the amount owed is held in the accounts receivable account until the debt is paid by the customer.
Inventory is the monetary value of all finished goods in stock as well as all raw materials and work-in-progress goods in the business’s possession. The makeup of the inventory account will differ depending on the type of business. For example, a manufacturing firm will carry a large amount of raw materials, while a retail store carries none. The makeup of a retailer's inventory typically consists of goods purchased from manufacturers and wholesalers.
Lastly, prepaid expenses are any expense the business pays for in advance, such as rent, insurance, office supplies, postage, travel expense, or advances to employees. They also list as current assets, as long as the company envisions receiving the benefit of the prepaid items within 12 months of the balance sheet date.
b. Non-current assets
Non-current assets are assets that are not turned into cash easily, are not expected to be turned into cash within a year and/or have a lifespan of more than a year. They can include tangible assets such as property (land), plant (factory), buildings, and equipment (machinery, tools, and computers). Non-current assets also can be intangible assets, such as goodwill and intellectual property like patents, copyright, and trademarks. While these assets are not tangible, they are often the resources that can make or break a company – for example, the value of a brand name like Levis or Starbucks can be worth a fortune.
Depreciation is calculated and deducted from most of these assets, which represents the economic cost of the asset over its useful life.
· Types of liabilities
On the other side of the balance sheet are the liabilities. These are the financial obligations a company owes to other entities. Like assets, they can be both current and long-term. Long-term liabilities are debts and other non-debt financial obligations, which are due after a period of more than one year from the date of the balance sheet. Non-debt long term liabilities may include future pension payments, rents on long term leases, and other contractual commitments. Current liabilities are the company's obligations that will come due, or must be paid, within one year. This includes both shorter-term borrowings, such as accounts payables, along with the current portion of longer-term borrowing, such as the latest interest payment on a 10-year loan.
· Shareholders' equity
Total shareholders' equity is the sum of (1) the total amount of money initially invested in the business, plus (2) all accumulated retained earnings, minus (3) all accumulated losses in previous years. Retained earnings are after-tax profits not paid out as dividends, but reinvested in the company at the close of each fiscal year. They are credited to the stockholders’ equity account. Likewise, in years where the company loses money (does not make a profit), the amount of the loss is debited from the shareholders’ equity account. The shareholders’ equity account represents a company's total net worth. In order for the balance sheet to balance, total assets on one side have to equal total liabilities plus shareholders' equity on the other.
PRESENTATION
10.2.2 Read the balance sheet
The Balance Sheet
Figure 1 is an example of a balance sheet, circa 2011, of Walmart.
As you can see from the balance sheet, it is broken into two areas. Assets are on the top and the below them contains the company’s liabilities and shareholders’ equity. It is also clear that this balance sheet is in balance where the value of the assets equals the combined value of the liabilities and shareholders’ equity.
Also note how the balance sheet is how it is arranged. The assets and liabilities are listed by how current the account is. Assets are ordered from most current to least current. Liabilities are ordered from short to long-term borrowings and other obligations.
|
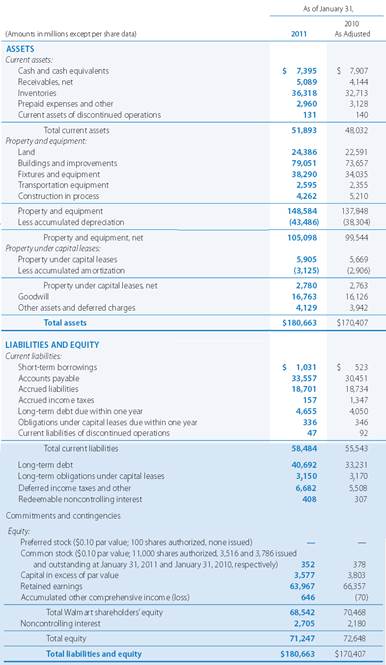
Figure 1 |
· Analyze the balance sheet with ratios
The main way one analyzes a balance sheet is by calculating a number of financial ratios. For the balance sheet, using financial ratios (like the debt-to-equity ratio) can give you a better idea of how healthy and efficient the company is. It is important to note that some ratios will need information from more than one financial statement, such as from the balance sheet and the income statement.
The main types of ratios calculated from the balance sheet are financial strength ratios and activity ratios. Financial strength ratios measure the company’s ability to pay its debts, and also show how the obligations are leveraged. These are subdivided into liquidity ratios and debt (or leveraging) ratios. Liquidity ratios measure the availability of cash to pay debts. These include the following:
Liquidity ratios:
Current ratio (Working Capital Ratio): Current assets / Current liabilities
Acid-test ratio (Quick ratio): [Current assets — (Inventories + Prepayments)] / Current liabilities
Cash ratio: Cash and marketable securities / Current liabilities
Operation cash flow ratio: Operating cash flow / Total debts
Debt ratios:
Debt ratios quantify the company’s ability to repay long-term debt and measure its financial leverage. These include
Debt ratios (leveraging ratios):
Debt ratio: Total liabilities / Total assets
Debt to equity ratio: (Long-term debt + Value of leases) / Average shareholders’ equity
Long-term debt to equity (LT debt to equity): Long-term debt / Total assets
Times interest earned ratio (Interest coverage ratio): EBIT / Annual interest expense*
(*EBIT stands for Earnings before Interest and Taxes. EBIT and Annual interest expense are not found on the balance sheet, but on the income statement.)
Financial strength ratios give investors an idea of how financially stable the company is and how the company finances itself. Activity ratios, by contrast, measure how efficiently the company uses its resources. They focus on current accounts to show how well the company manages its operating cycle (which include receivables, inventory and payables).
Activity ratios (Efficiency Ratios):
Average collection period: Accounts receivable / (Annual credit sales ÷ 365 days)
Degree of operating leverage (DOL): %Change in net operating income / %Change in sales
DSO ratio: Accounts receivable / (Total annual sales ÷ 365 days)
Average payment period: Accounts payable / (Annual credit purchases ÷ 365 days)
Asset turnover: Net sales / Total assets
Stock turnover ratio: Cost of goods sold / Average inventory
Receivables turnover ratio: Net credit sales / Average net receivables
Inventory conversion ratio: 365 days / Inventory turnover
Inventory conversion period: (Inventory / Cost of goods sold) x 365 days
Receivables conversion period: (Receivables / Net sales) x 365 days
Payables conversion period: (Accounts payable / Purchases) x 365 days
Cash conversion cycle: (Inventory conversion period + Receivables conversion period – Payables conversion period)
Several of these also require information from the other financial statements.
PRESENTATION
10.2.3 The income statement
The income statement is the second of the three financial statements with which stock investors need to become familiar. The income statement summarizes a company's revenues (sales) and expenses quarterly and annually for its fiscal year. The final net figure – often called The Bottom Line – is what investors are most interested in. But there are also several other figures in the income statement that the wise investor will pay close attention to.
1. Terminology and formats
There are many different names for income statements: “P&L” (which stands for Profit and Loss), “earnings statement”, “statement of income,” “statement of earnings,” “statement of operations” and “statement of operating results.” All mean the same thing. Likewise, the terms "profits," "earnings" and "income" all mean the same thing and are used interchangeably.
Two basic formats for the income statement are used in financial reporting presentations - the multi-step and the single-step. These are illustrated in Figure 2 with two simplistic examples:
Multi-Step Format |
Single-Step Format |
Net Sales |
Net Sales |
Cost of Sales |
Materials and Production |
Gross Income* |
Marketing and Administrative |
Selling, General and Administrative Expenses (SG&A) |
Research and Development Expenses (R&D) |
Other Income & Expenses |
|
Other Income & Expenses |
Pretax Income |
Pretax Income* |
Taxes |
Taxes |
|
Net Income (after tax)* |
-- |
Figure 2 Income statement formats
In the multi-step income statement, four measures of profitability (*) are revealed at four critical junctions in a company's operations: gross, operating, pretax, and after tax. In the single-step method, the gross and operating income figures are not stated; nevertheless, they can be calculated from the data provided: gross income is equal to sales minus materials and production; operating income is equal to gross income minus marketing, administrative, and R&D expenses.
Investors must always remember that the income statement recognizes revenues when they are earned (i.e., when goods are shipped or services rendered), not when they are received. Likewise, the income statement recognizes expenses when they are incurred, not when they are paid. With accrual accounting, the entry of revenue and expense credits and debits on these accounts does not necessarily coincide with the actual receipt and payment of cash. The income statement measures profitability, not cash flow.
2. Income statement accounts (Multi-step format)
- Net sales (or net revenue): Often just called “sales”, this is the monetary value of a business’s sales of goods and services to its customers. While the firm’s net income (its "bottom line") gets most of the attention from investors, the "top line" is where the revenue or income process begins. Also, whereas the bottom line can be manipulated through creative accounting, the top line is captive to reality and hard evidence. Also, in the long run, operational efficiency and thus profit margins on a company’s existing products tend to eventually reach a maximum that is difficult to improve on. Established companies with mature products typically can grow no faster than their revenues.
- Cost of sales (or cost of goods sold (COGS), and cost of services): Manufacturers use cost of goods sold. It is the expense incurred for all inputs (raw materials, labor, and manufacturing overhead) used in the production of its products. Depreciation expense also belongs in the cost of goods sold, but it may be stated separately. For wholesalers and retailers, the cost of goods sold is what they paid for the goods they have resold. (The money paid for unsold goods still in inventory is not included in COGS, but in the inventory accounts.) Service businesses use cost of services rendered or cost of revenues. Most of the cost in cost of services rendered will be allocated overhead.
- Gross profit (or gross income or gross margin): A business’s gross profit does more than simply represent the difference between net sales and the cost of sales. Gross profit provides the resource to cover all of the company's other expenses. Obviously, the greater and more stable a company's gross margin, the greater potential there is for positive bottom line (net income) results. Businesses with high gross profits and comparatively low net profits are likely bloated: they are spending too much money on overhead.
- Selling, general and administrative expenses: Often called SG&A, this account comprises a company's operational expenses. Management exercises a great deal of control over this expense category. Consequently, investors should watch the trend of SG&A expenses, as a percentage of sales, very closely to detect signs of managerial efficiency or inefficiency.
- Operating income: Operating income is calculated by subtracting SG&A from a company's gross profit. Operating income is a company's earnings from normal operations before any non-operating income and/or costs such as interest expense, taxes and special items. Reported income at the operating level is harder to manipulate, and is thus a more reliable measure of profitability than net income.
- Interest expense: This is the costs of a company's borrowings. Sometimes companies record a net figure here, subtracting out the interest income from invested funds. Be sure to look for the explanatory note explaining if this was done, and then break out the two figures (interest paid on borrowed funds vs. interest earned on invested funds) to use in analysis.
- Pretax income: Earnings before tax is a carefully watched indicator of profitability. There are a vast number of techniques for companies to avoid or minimize taxes that affect their reported income. While it is good to know that a company has excellent tax accountants, the difference they make has nothing to do with a company's business operations or how efficiently they are being managed. Therefore, it is important to use pretax income to more accurately gauge the firm’s efficiency and profitability.
- Income taxes: As with other items on the income statement, the reported income tax item has not actually been paid – it is an estimate of what a company expects to have to pay.
- Special items or extraordinary expenses: There are a vast range of unusual events that can result in charges against income. They include fines and lawsuit damages (and awards), restructuring charges, unusual or nonrecurring items, and costs of discontinuing operations (i.e., closing a factory). These write-offs are supposed to be one-time events. Investors need to take these special items into account when comparing changes in profits from year to year because these special items and extraordinary expenses can distort evaluations of the firm’s efficiency and growth. For example, if a firm incurred a huge extraordinary expense two years ago, but had no such expense in the following year, the naïve investor who did not take note of the extraordinary expense would see only a substantial jump in net profit causing him to think it was a good time to invest in that company.
- Net income (or net profit or net earnings): This is the bottom line, the most commonly used indicator of a company's profitability, because it is out of this account that dividends (if any) to investors will be paid. Lack of net profits in a young, high growth technology company, however, is not a bad thing. It may even be perceived as a good thing: a sign that management is re-investing surplus revenues in R&D to spur further growth while keeping revenues out of the hands of the taxman. Investors in such companies are not interested in dividends in the near term, but in the rise of the value of the company’s stock price in the market, which will increase as the young company grows and introduces new and more innovative products. Investors in such companies act as speculators, hoping to profit from the increased value of their shares. It is in older, more established companies where investors expect to see a reasonably steady stream of dividends. Of course, if expenses exceed income, net profit will be negative: the firm will post a loss. After dividends (if any) are paid, the remaining net income becomes part of retained earnings.
- Comprehensive income: This relatively new (1998) concept, adjusts reported income, taking into account the effect of foreign currency exchange adjustments, minimum pension liability adjustments, unrealized gains/losses on certain investments, and other such items. These adjustments, however, result from economic and political volatility beyond management’s control, and so give no indication of the company’s long-term profitability. Thus the new investor should treat this category as a special instance of extraordinary expenses.
3. Sample income statement
Now let's take a look at Figure 3, a sample income statement for company XYZ for FY ending 2008 and 2009 (expenses are in parentheses).
Income Statement For Company XYZ FY 2008 and 2009 |
(Figures USD) |
2008 |
2009 |
Net Sales |
1,500,000 |
2,000,000 |
Cost of Sales |
(350,000) |
(375,000) |
Gross Income |
1,150,000 |
1,625,000 |
Operating Expenses (SG&A) |
(235,000) |
(260,000) |
Operating Income |
915,000 |
1,365,000 |
Other Income (Expense) |
40,000 |
60,000 |
Extraordinary Gain (Loss) |
- |
(15,000) |
Interest Expense |
(50,000) |
(50,000) |
Net Profit Before Taxes (Pretax Income) |
905,000 |
1,360,000 |
Taxes |
(300,000) |
(475,000) |
Net Income |
605,000 |
885,000 |
Figure 3 Sample company income statement
From this we can see that between the years 2008 and 2009, Company XYZ increased sales by about 33%, while reducing cost of sales from 23% to 19% of sales. As a result, gross income in 2009 increased significantly. Meanwhile, general operating expenses increased by a modest $25,000. In 2008, operating expenses were 15.7% of sales, while in 2009 they were only 13%. This is extremely favorable given the large sales increase.
Consequently, XYZ’s bottom line increased from $605,000 in 2008 to $885,000 in 2009. The positive trends in all the income statement items, both income and expense, have improved XYZ’s profit margin from 40% to 44%. XYZ experienced an impressive increase in sales for the period reviewed and was also able to control the expenses. These are indicators of very competent management.