Module 15: ASEAN Food Production and Supply
ชุดวิชาภาษาอังกฤษสำหรับงานอาชีพในประชาคมอาเซียน ให้บริการเปิดสอนในภาคการศึกษาที่ 2/2557 จำนวน 15 โมดูลการเรียน
Table of Contents
LanguageFocus
SECTION 15.2
Language Focus 4:
Describing graphs and charts
Line graphs and bar charts offer meaningful representation of information. They can leave a lasting impression on an audience and offer comparison of quantified data to make an interesting presentation. As a result, the audience’s attention is captured and directed towards the information.
In doing business, instead of using a series of figures and statistics, choosing the right sort of graphs helps to reveal trends.
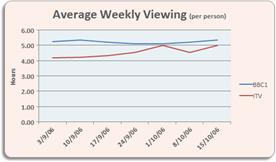
1) Line graphs illustrate a trend over time. |
|
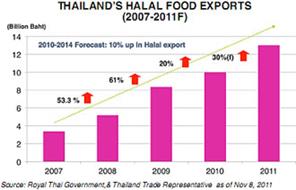
2) Bar charts illustrate patterns or information about frequency. |
|
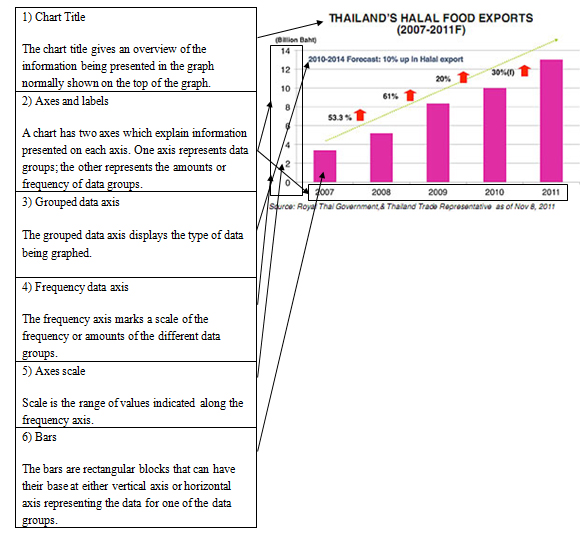
Parts of bar charts
Reading Charts
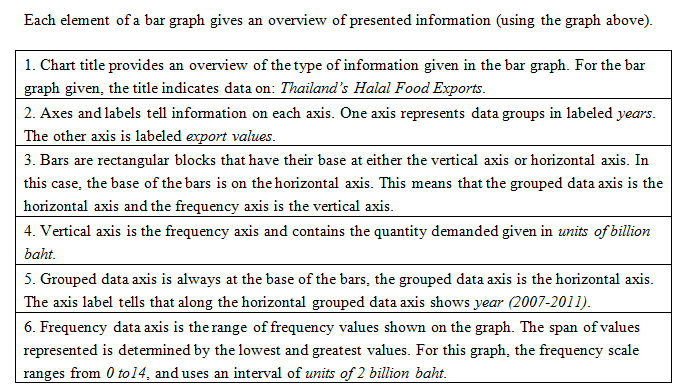
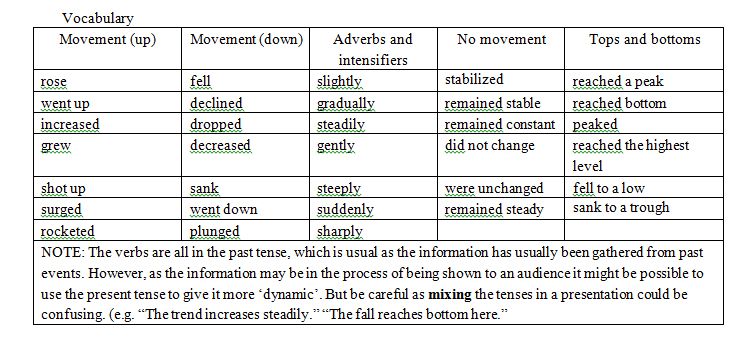
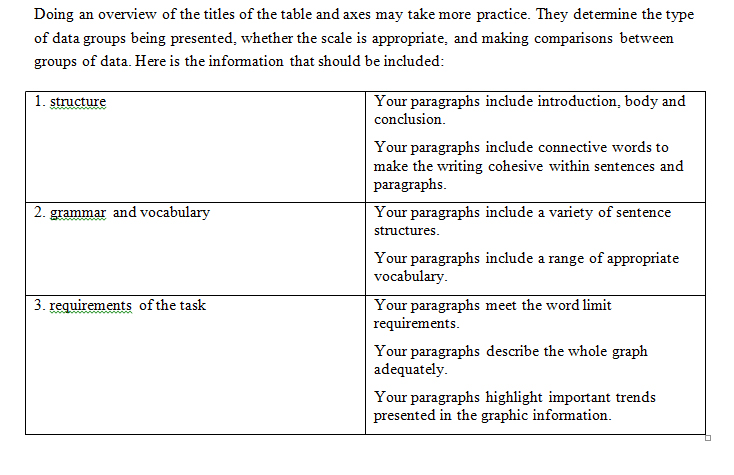
Describing charts or graphs
Vocabulary